A Guide on the Quantity Theory of Money
Milton Friedman: “Inflation is and always a monetary phenomenon”
What is the Quantity Theory of Money?
Milton Friedman, the modern founder of the Quantity Theory of Money (QTM), best described it:
Inflation is and always a monetary phenomenon, resulting from and accompanied by a rise in the quantity of money relative to output.
Inflation, or the general increase in the price of goods and services, is caused when the money supply increases faster than the output of such goods and services in the economy.
Put differently, the over-printing of money compared to the amount of goods and services produces inflation that diminishes the value of money over time.
What is money?
One might think the answer is obvious, but actually it’s not in a well-developed economy like that of China, Eurozone, Japan, United Kingdom (UK) and the United States (US).
QTM works optimally with broad definitions of money.
Broad money encompasses liquid forms of money, like cash and current/checking accounts, and less liquid forms such as savings accounts, timed deposits and certain investment instruments.
Cash is normally disregarded since only 3% of transactions are done in notes and coins.
What are the primary sources of money?
Central banks historically issued 5% of the money supply but that percentage skyrocketed to around 20% or higher once they financed government debt through a process known as “quantitative easing” or “QE” after the 2008 Great Financial Crisis.
Commercial bank lending is the primary engine of money creation, which is probably a surprise to most readers.
In an excellent 2014 publication, the Bank of England challenged popular misconceptions that banks acted as intermediaries lending out customer deposits or that they “multiply up” their funds - known as reserves - held up at the central bank to establish loans or deposits.
Richard Werner, a banking and economics professor at the University of Winchester and father of QE, published the first empirical proof that banks generate money when they grant loans.
What is the link between money supply and inflation?
Milton Friedman derived a simple formula to explicate the link between money supply and inflation:
MV = PY
Where:
M = Money Supply
V = Velocity (i.e. the rate at which each unit of money circulates in the economy)
P = Price level or Inflation
Y = Real Output or Real Gross Domestic Product (i.e. value of all goods and services in an economy adjusted for inflation)
So, as the formula demonstrates, any sustained money supply changes spills over into the nominal economy (i.e. the real economy plus the inflation rate) and then inflation.
This spillover does not happen instantaneously. There are always long and variable lags of 1-3 years between a change in the money supply and inflation.
What factor drove inflation way up in 2021 - 2023 and then quickly down in 2024 - 2025 in the US, Eurozone and UK?
Money supply changes.
Between 2020-2021 at the pandemic’s height, the US Federal Reserve (Fed), the European Central Bank and the Bank of England argued for “transitory inflation” meaning that it would be short-term and self-correcting.
In reality, they primed monetary growth by monetising the government debt using aggressive QE (i.e. purchasing government debt). Like clockwork, the inflation shot up in all three at nearly the same time period.
Subsequently, the Fed and its counterparts contracted their money supply in 2021 until 2024 largely through “Quantitative Tightening” or reverse QE (i.e. by selling or letting government bonds mature).
No surprise, the Eurozone, UK and US witnessed a disinflationary trend since 2023.
Is there any evidence on the veracity of the Quantity Theory of Money?
Yes, there is.
In 2001, the Federal Reserve of Minneapolis published a study evidencing a high “correlation” (i.e. relationship) between growth rates of money supply and the general price level in 110 countries over a 30 year period.
Steven Hanke, Professor of Applied Economics at Johns Hopkins University, published an updated study confirming the strong link between the money supply and inflation in 147 countries between 1990-2021.
Thirdly, the post-pandemic inflation rates in China, India, Japan and Switzerland remained low or muted given that they did not spike their money supply in 2020-2021.
Do you need to be an expert to apply the Quantity Theory of Money to anticipate inflationary trends?
Definitely not.
Steve Hanke calculated utilising the QTM formula that the year-on-year money supply rate for the Eurozone, Japan, UK and US has to be around 6% to achieve a 2% inflation target.
By contrast, China’s annual money supply growth consistent with its 3% inflation target is 11-13%.
One can predict the pathway of inflation by monitoring the appropriate monetary aggregate of a particular country.
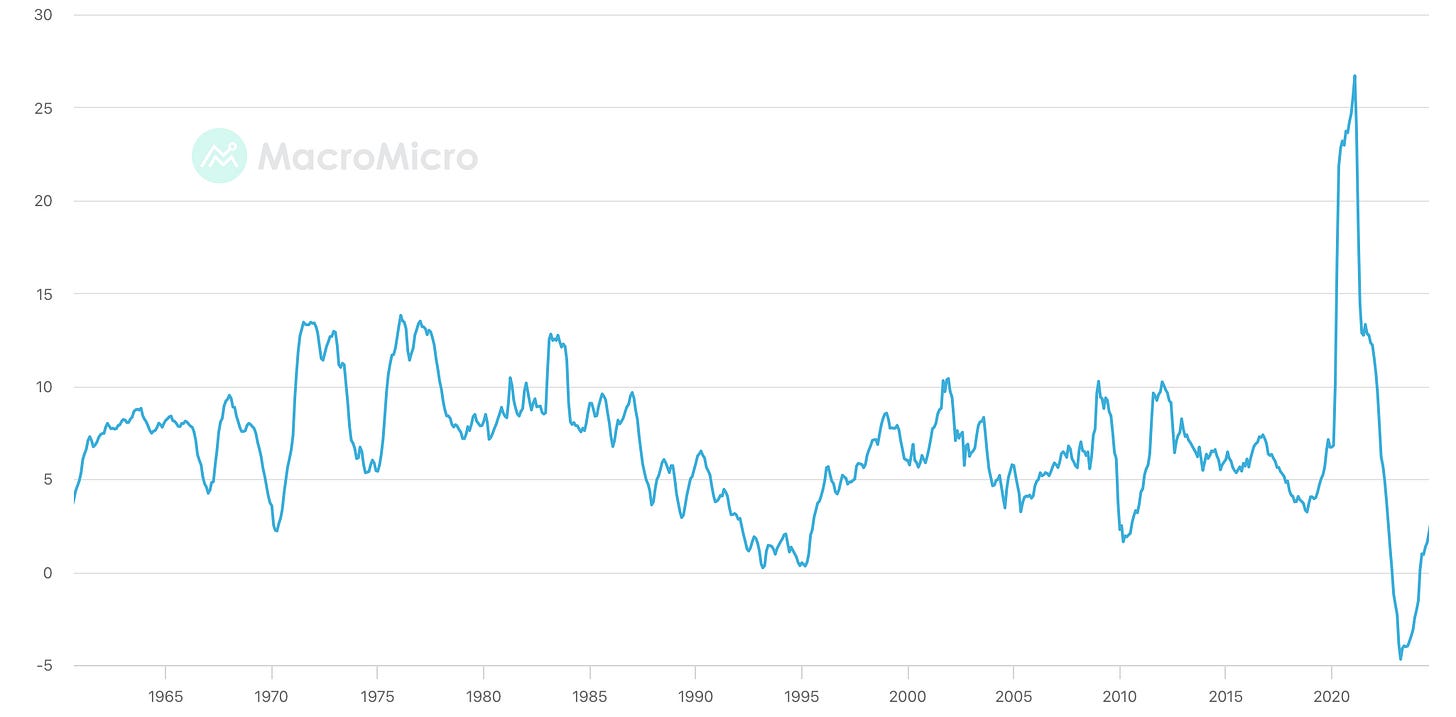
For instance, the Fed releases each month its measure of broad money supply called “M2” money supply, which at 4.12 % year-on-year increase as of March 2025, is below the 6% benchmark consistent with a 2% inflation target. That indicates a US inflation rate of 2% or below in 2025 and 2026.
But, one should pay close attention to the ongoing pattern of M2, as shown in the graph below:
Considering the gentle upward trend, this begs the question: will M2 settle at a level close to or at 6% or will it exceed it in the short-to-medium term? This will inform the astute observer about US inflation in the months and years ahead.


