


“Cost of living crisis” invaded the UK lexicon ever since inflation, or the general increase of goods’ and services’ prices, dominated the economy following the global COVID pandemic in 2021/2022.
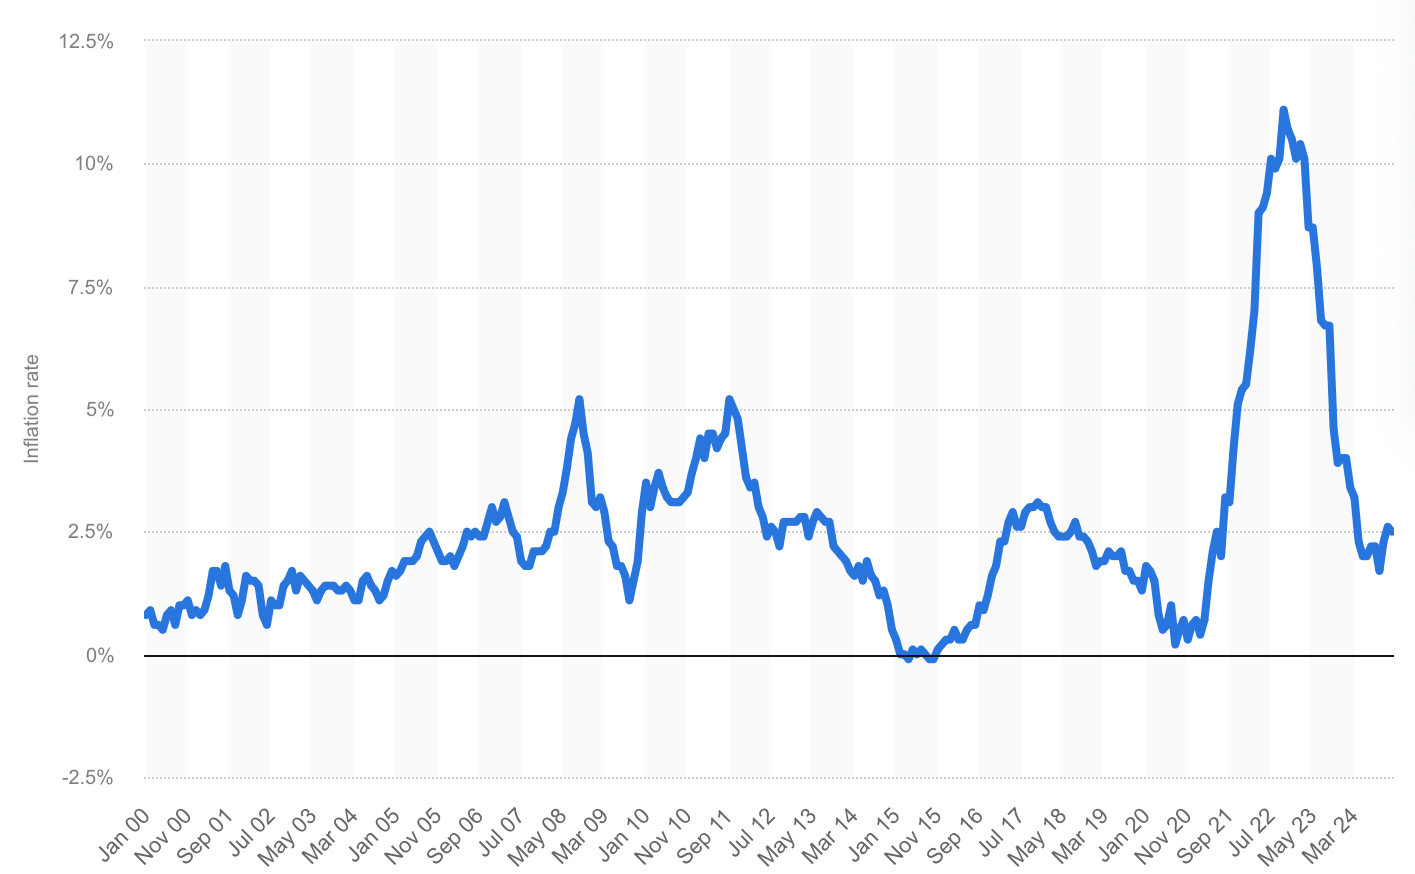
Skyrocketing from 0.7% in March 2021 to 11.1% in October 2022, it declined precipitously to 2.5% by December last year, as can be seen in the graph below:
Going forward, the Bank of England predicts that:
inflation is on a bumpy path and we expect it to rise to 3.7% towards the middle of 2025. This is because of increases in global energy costs and some regulated prices, such as water bills. But it will be only temporary and inflation should fall back to 2% after that.
It is very difficult to predict how the economy will evolve. Another global shock could significantly change the situation. For example, global trade tariffs and developments in the Middle East may impact some prices.
Revealingly, the Bank cites external factors, principally global energy costs, water bills and uncertainties over global trade tariffs and Middle Eastern “developments” as the source of inflation. Nowhere, does it accept any responsibility for influencing its primary mandate of price stability.
In spite of the Bank’s research department populated by high-flying Phd economists from elite universities, its track record on inflation leaves much to be desired. It failed to anticipate the upward momentum between 2021-2022 and the subsequent disinflationary episode unfolding today.
By focusing on “exogenous” or external factors for explaining inflationary changes, the Bank’s predictions on price dynamics are wide off the mark.
Unsurprisingly, the average investor, business owner and household, who fail to anticipate inflation accurately, end up making wrong decisions on borrowings, corporate investments and financial planning.
A Better Way to Forecast Inflation
Bank of England economists declared that recent:
high inflation in the UK was driven primarily by higher costs [i.e. “cost-push” inflation]… Covid-induced supply shortages, the invasion of Ukraine and lack of workers post pandemic all led to ‘cost-push’ inflation.
Simultaneously, they belittled “demand-pull” inflation defined as:
when there is an increase in the demand for something compared to its supply. For example, too much money in the economy can lead to higher demand for goods and services than there are available, which raises prices and inflation.
In effect, the quote above in bold-type demonstrates that the Bank is pouring cold water on the one metric that it controls in the economy as the primer of inflation: money supply.
That is a shocking contention to make in light of its quadrupling the year-on-year growth of broad money during the pandemic, as shown in the graph below:
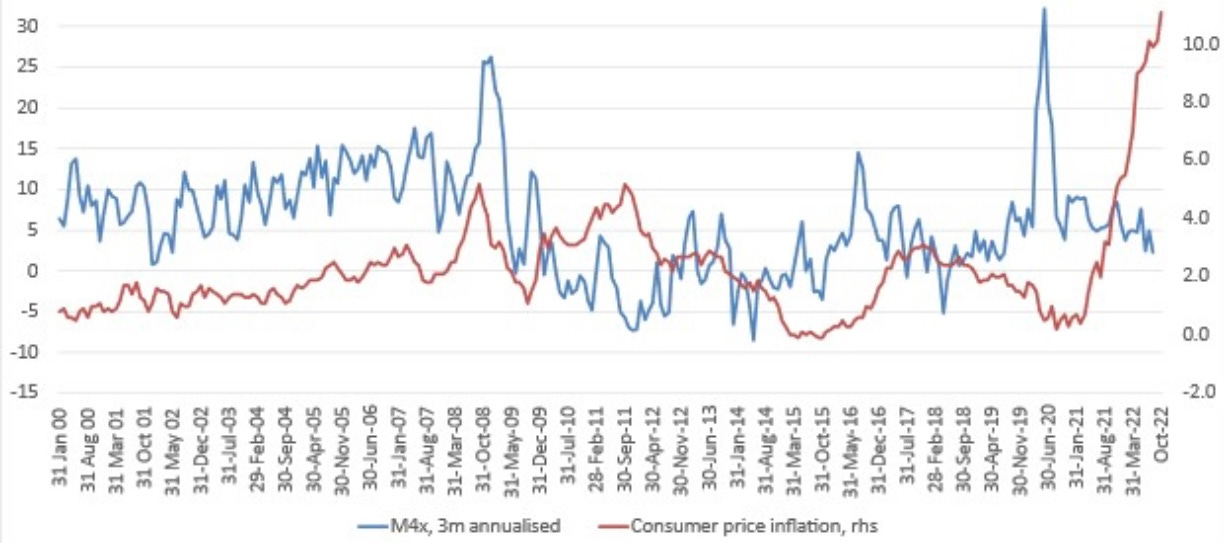
Similarly, the rapid disinflation that commenced in end-2022 is accounted for by the steep decline in money supply from early 2021 onwards.
Magic Target
To achieve the Bank of England inflation target of 2%, the annual increase of UK’s broad money metric called “M4ex” has to be around 6%, as calculated by Steve Hanke, an eminent economist at Johns Hopkins University:
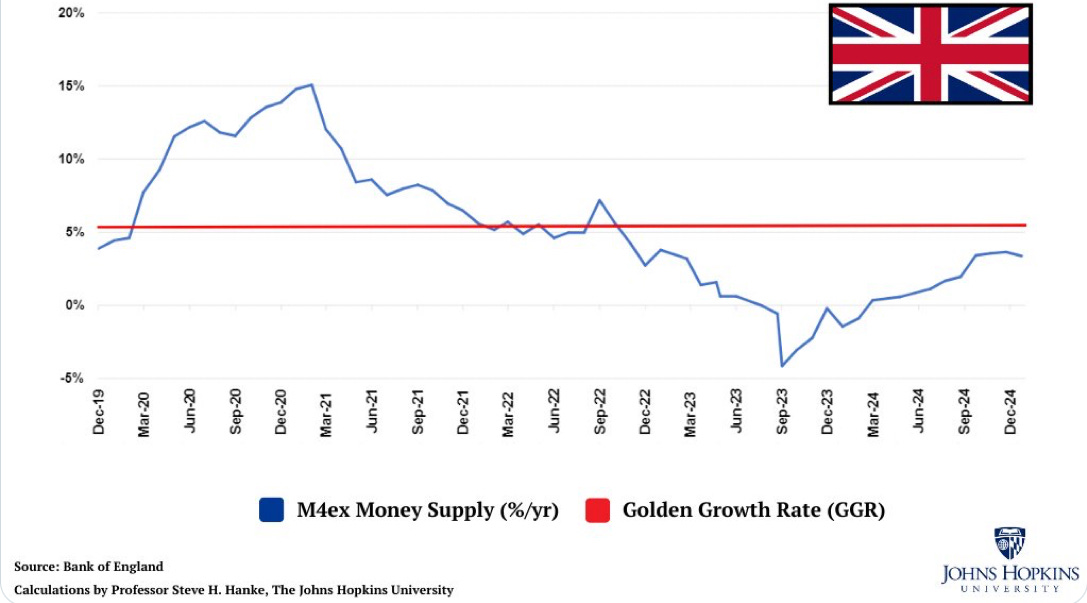
Unsurprisingly, the inflation rate jumped with a lag, which can oscillate between 1 - 3 years, when the money supply growth crossed the 6% benchmark and then quickly fell - again with a long lag - following its contraction.
Given the current M4ex growth rate of 3.3% is still below the 6% threshhold, inflation will continue to descend to 2% by year-end and remain at or close to that level for much of 2026.
In the next article, the Quantity Theory of Money will be outlined to illustrate the link between money supply and inflation.
.

Thanks for reading Thoth Talk! Subscribe for free to receive new posts and support my work.