

Don’t Buy the Doom: Druckenmiller, Dalio, Gundlach and Wall Street Are Wrong on a U.S. Debt Crisis
As Billionaires and Wall Street Cry Armageddon, Gold and History Whisper a Darker Economic Truth
Renowned hedge fund managers Ray Dalio, Stanley Druckemiller and “Bond King” Jeffrey Gundlach along with Wall Street and the financial media have been sounding the alarm bells over the soaring U.S. public debt.
Mr Dalio, for instance, prone to colourful rhetotic issued a dire warning of the “American debt death spiral” while his fellow billionare Mr Druckenmiller warned that the U.S., debt crisis was worse than he imagined. Mr Gundlach is adamant that a “reckoning” for U.S. Treasuries is inevitable.
Looking at the graph below, one can hardly blame them. Measured against Gross Domestic Product (GDP) - i.e. the size of the economy - the public debt skyrocketed from around 41% at the time of the 2007-2008 Great Recession to 122% by 2024. That exceeded the previous record of 106% at the end of World War II.

According to the non-partisan Congressional Budget Office projections, using conservative economic assumptions, the fiscal drain will continue to grow exponentially to 156% of GDP by 2055.
And much of the fiscal irrectitude is funding so-called “entitlements” or government transfer payments to the elderly and the poor as opposed to growth-boosting productive investments in the economy.
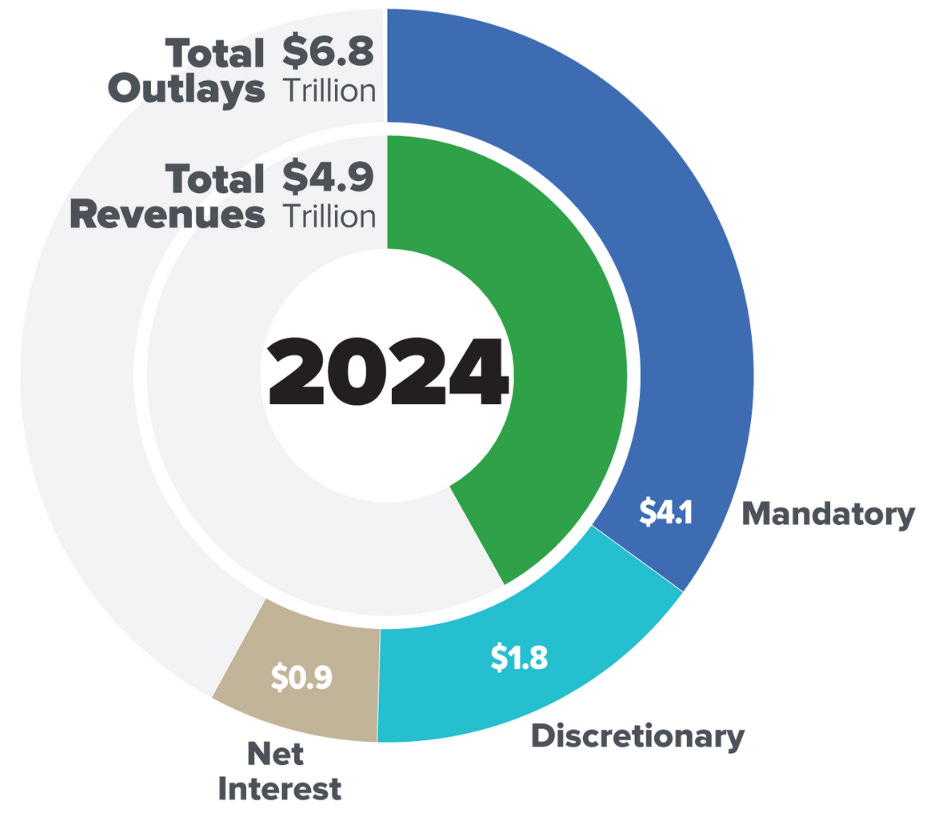
As the above infographic demonstrates, 60% of federal government outlays goes to “mandatory” programmes or entitlements and 13.2% to pay the interest on the debt, which represents nearly one-fifth of tax revenues.
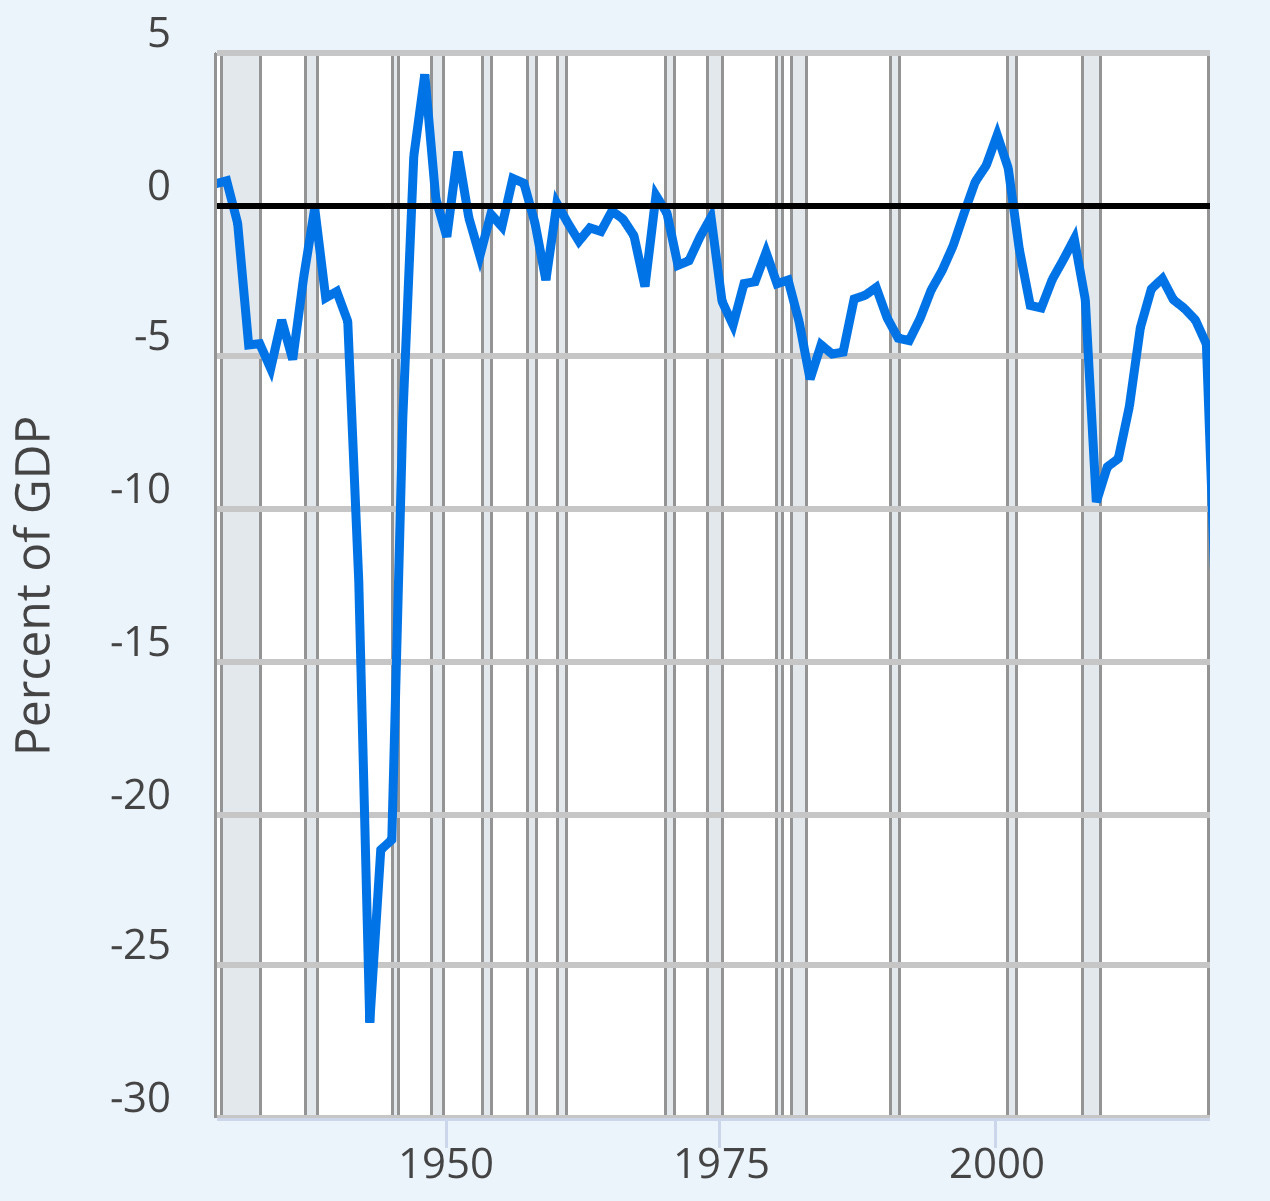
No wonder, the federal deficit, shown in the graph below, reached a staggering 6.3% of GDP in 2024 in the midst of an economic boom.
Back to the Future
On the surface, the headline figures suggest that the U.S. will soon face a fiscal retribution of some sort, as Messrs Dalio, Druckenmiller and Grundlach pontificate.
If history is any indication, the chances of a debt crisis occurring in the near future are quite low. Following World War II, the United States faced a heavily indebted economy but succeeded in bringing it under control over the next three decades. Understanding how this was achieved can offer insight into the strategies today's authorities are likely to adopt to prevent fiscal chaos.
Economists Julien Acalin and Laurence M. Ball in 2024 published research to prove that a strict below-inflation interest-rate policy and periodic inflationary surges rather than elevated economic growth contributed the most to reducing debt-to-GDP from 106% in 1946 to 23% in 1974.
They estimated that without financially repressive interest rates and inflation, America’s debt in 1974 would have been 74% of GDP rather than 23%.
Avoiding a debt default remains a reasonable expectation, especially in light of former Fed Chairman Alan Greenspan’s assertion that the government can always “print money” to meet its obligations.
To manage the debt burden, policymakers are likely to rely on a mix of below-inflation interest rates and moderate inflation—carefully calibrated to be acceptable to the general public while steadily reducing the dollar’s purchasing power over time.
Follow the Money
Wall Street and many “experts” peddle the narrative that America’s exploding debt and deficits are spurring the nebulously-defined mysterious “bond vigilantes” to push the 10-Year Treasury bond yield higher and higher:
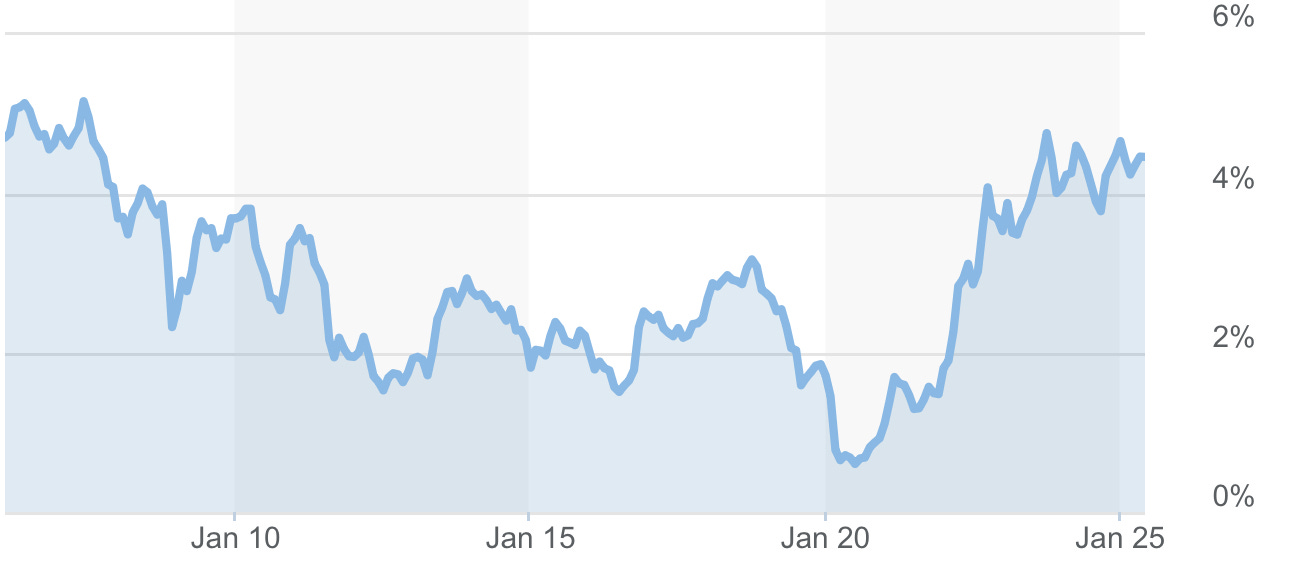
Their argument is reinforced by a graph comparing the growth of U.S. gross debt with the 10-Year Treasury yield. Since 2020, the data suggests a positive correlation between the two, indicating that rising debt levels may be pushing up bond yields:
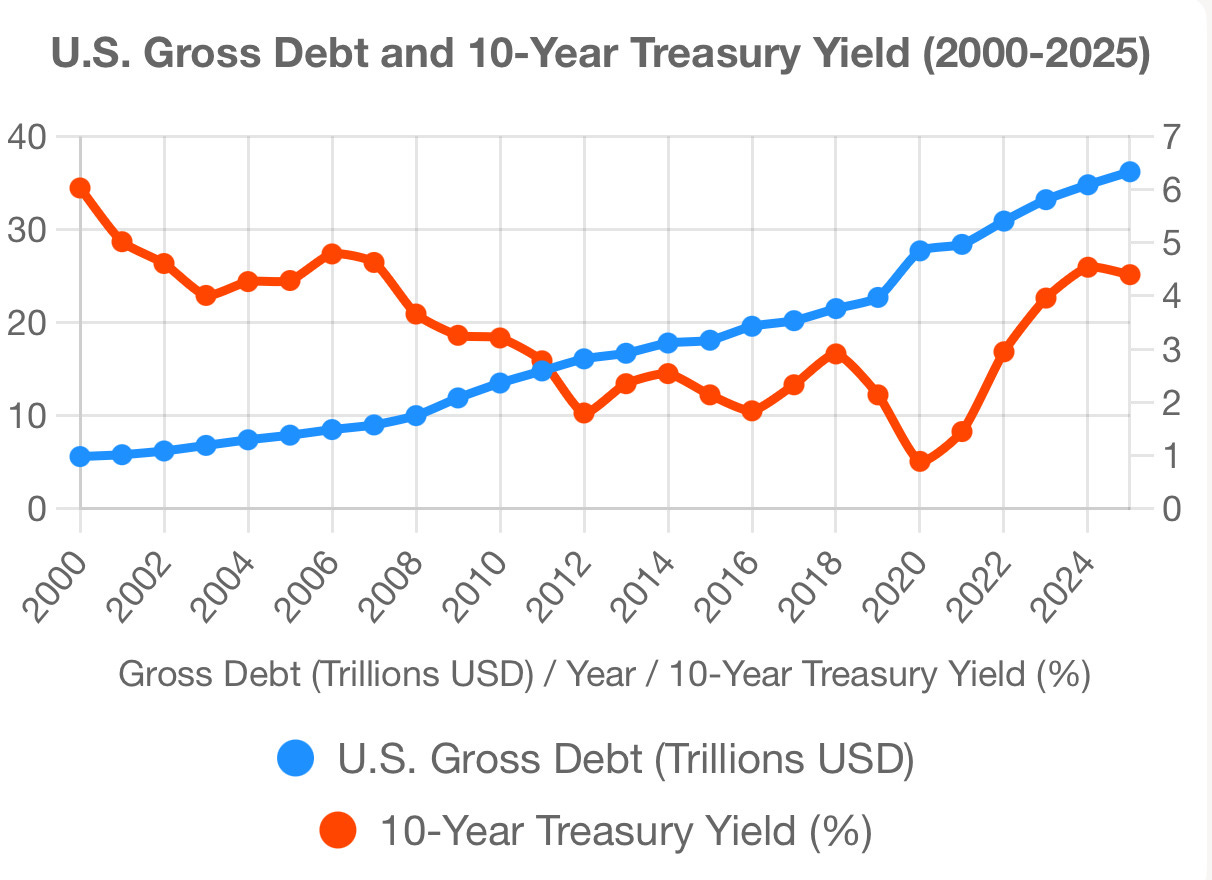
However, examining a longer timeframe reveals no clear linear relationship. For instance, between 2009 and 2020, gross debt doubled from $11.9 trillion to $22.7 trillion, while the 10-Year Treasury yield declined from 3.26% to 2.14%.
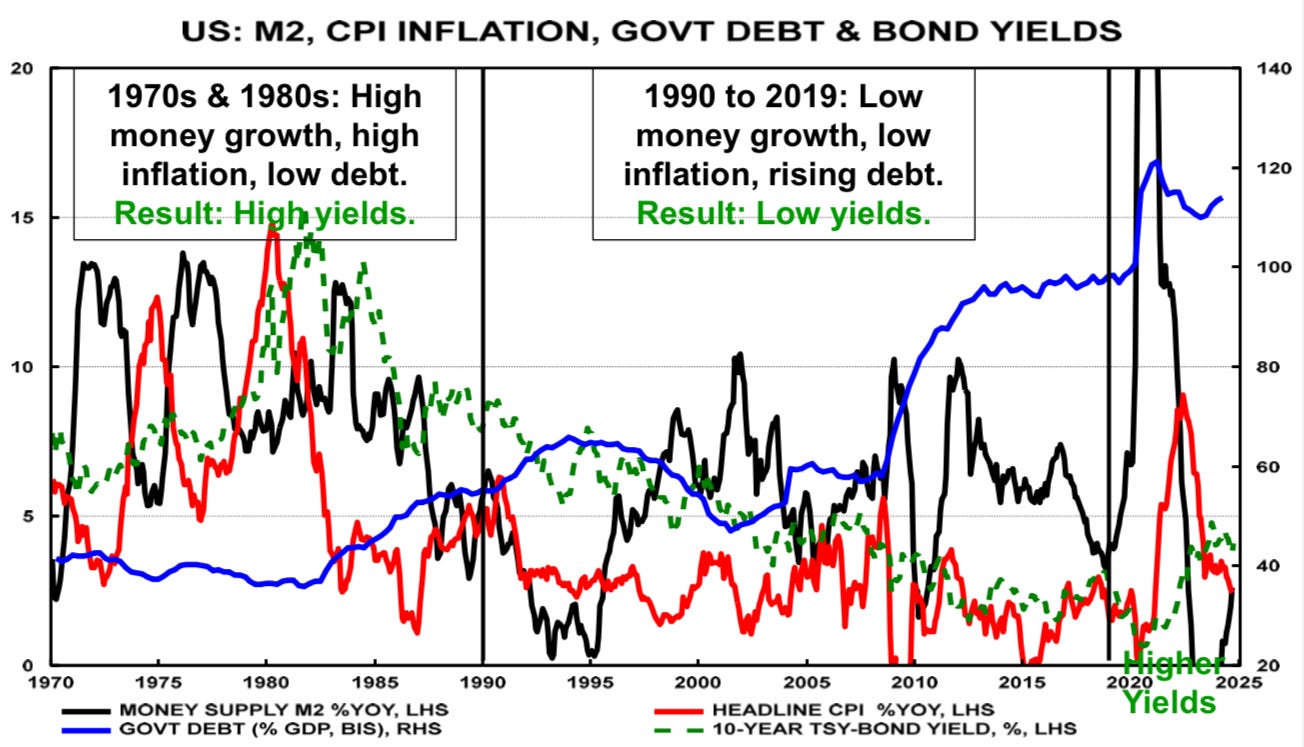
So, what can better determine the changes in the 10-year Treasury yield? Money supply and inflation:
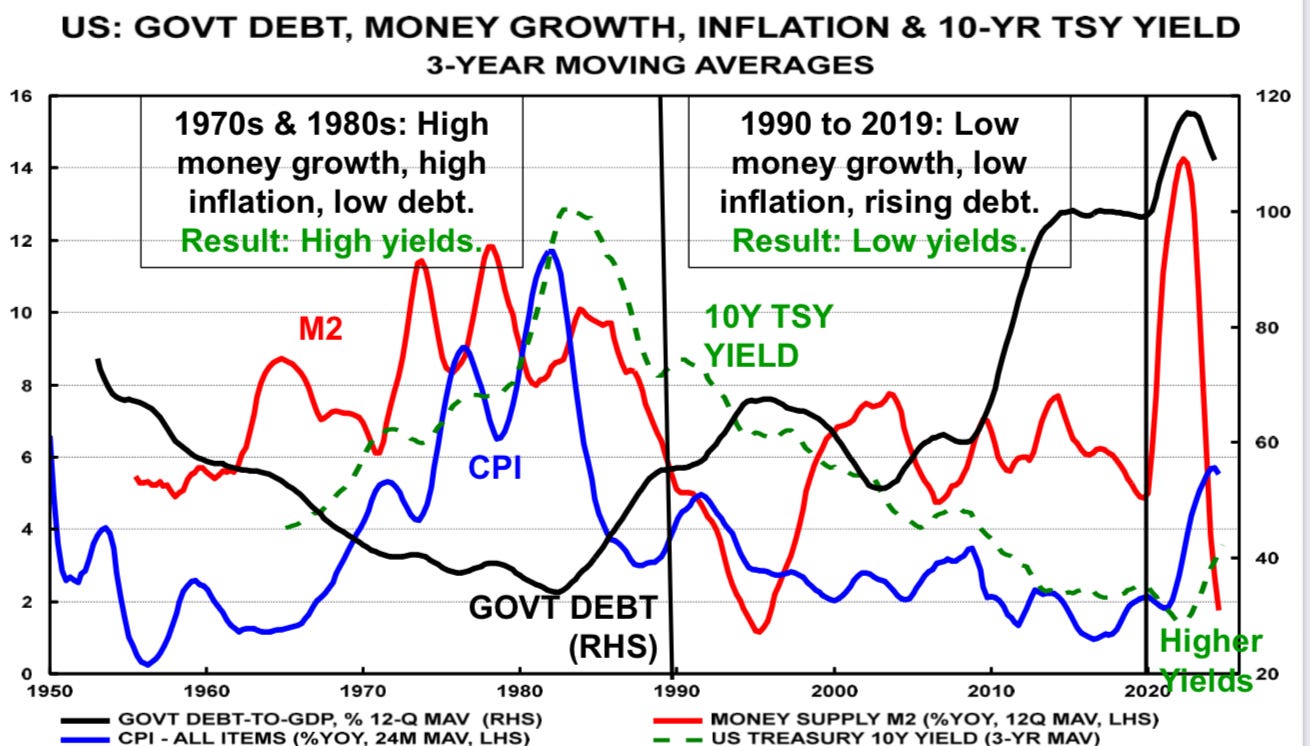
John Greenwood OBE—former chief economist of INVESCO and architect of the Hong Kong currency board scheme in 1983—created the graph above, which shows M2, a broad money supply measure published by the U.S. Federal Reserve, leading the Consumer Price Index (CPI), which in turn leads the 10-Year Treasury bond yield.
During the 1970s and 1980s, rapid money supply growth coincided with high inflation and low debt levels, resulting in high yields. In contrast, between 1990 and 2019, slower money growth aligned with low inflation and rising public debt, producing low yields.
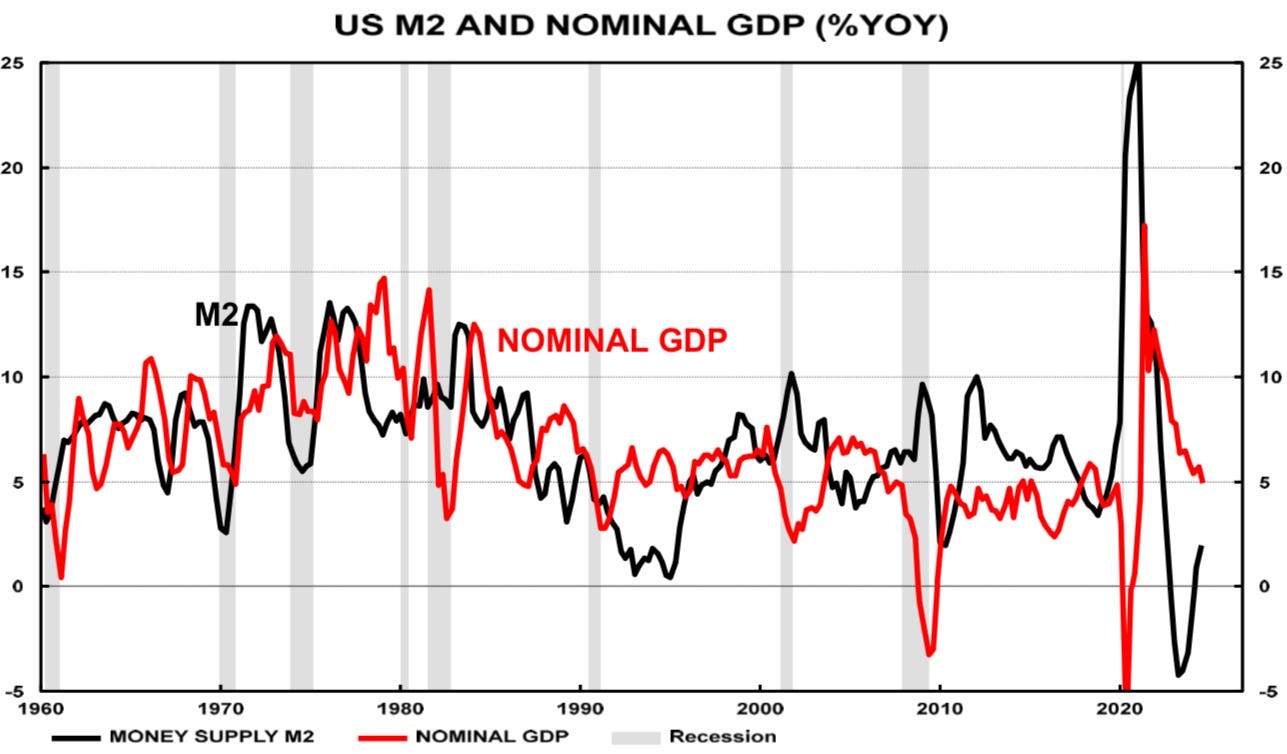
What happens is that changes in broad money drives changes in nominal GDP growth:
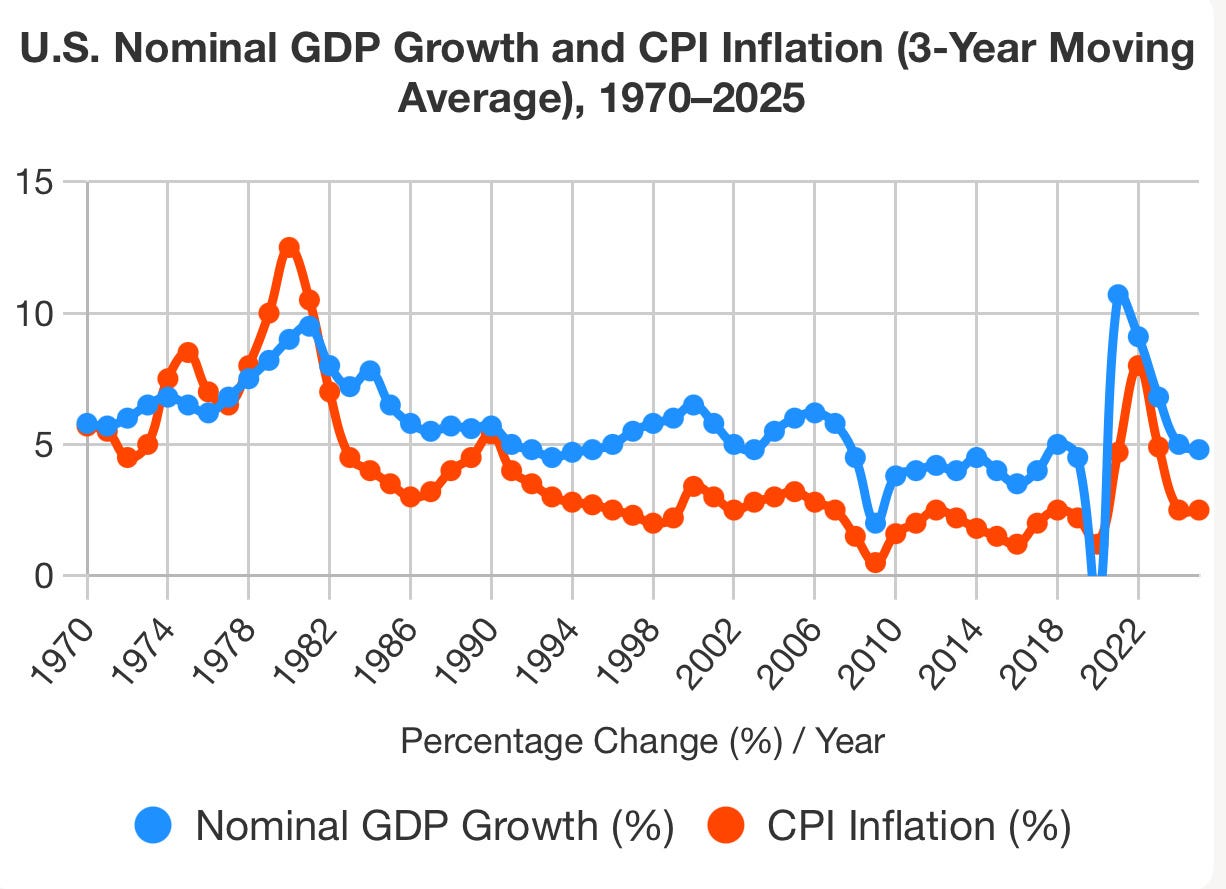
And changes in nominal GDP drives changes in inflation:
This relationship influences the 10-Year Treasury yield, a fact empirically demonstrated by Richard Werner, Professor of Banking and Economics at the University of Winchester:
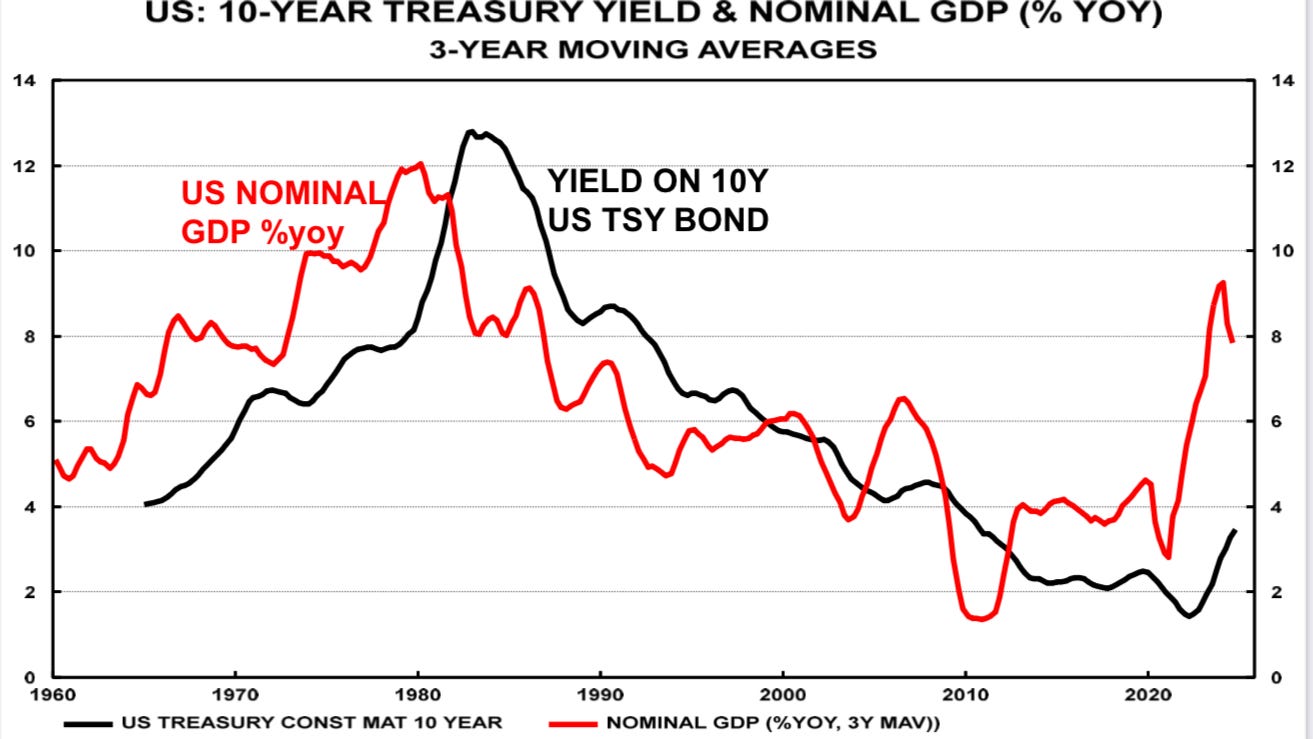
However, celebrated hedge fund managers, Wall Street and so-called experts often overlook that the alignment between nominal growth, inflation, and long-term bond yields will ultimately occur—albeit with significant short-term volatility, as vividly illustrated by this graph:
Expect volatility to surge beyond previous norms, driven by an unprecedented mix of factors: the Fed’s pandemic-era massive money printing, Covid-induced global economic shutdowns, supply chain disruptions, inflationary spikes, rapid rate hikes from zero percent, quantitative tightening (the Fed shrinking its balance sheet), record fiscal deficits, Trump’s tariffs, and ongoing geopolitical tensions.
Listen to Gold
Rising gold prices partly reflect the ballooning U.S. public debt and deficits, but the persistent upward trend signals something deeper and more troubling.
Gold seems to warn that soaring debt is taking a serious toll on the long-term outlook for economic growth and overall well-being—evidenced by the bottoming of the gold-to-S&P 500 price ratio in 2021.
Notably, gold and the S&P 500 serve as indicators: gold often predicts political and economic upheavals, while the S&P 500 acts as a rough proxy for the health of the U.S. economy.
As highlighted in the previous article, “Forget the Analysts: Gold is the Unfiltered Oracle of Global Political and Economic Turmoil”, every time this ratio has hit a low point, significant economic and financial crises have followed.
It is highly likely that the next wave of turmoil will be tied to a prolonged period of U.S. economic stagnation or stagflation—a combination of slow growth and moderately high inflation.
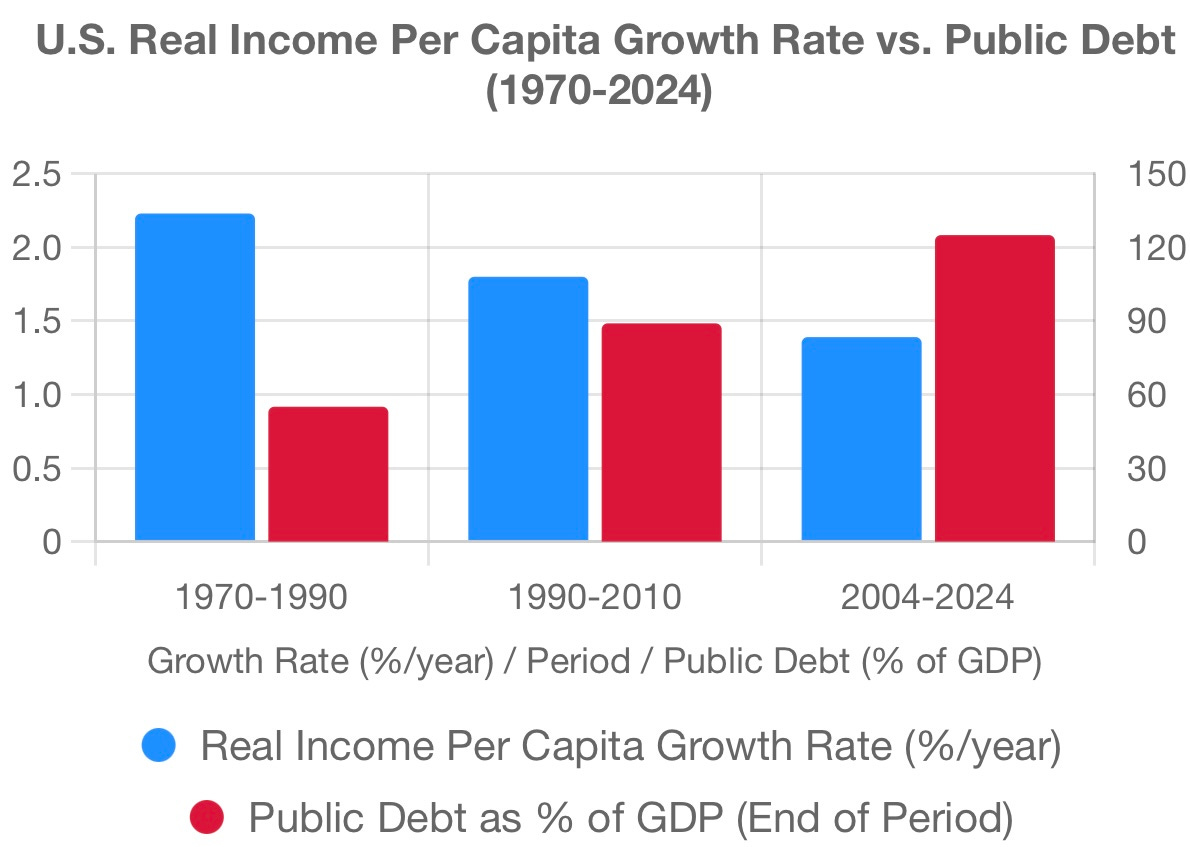
Strong evidence supports the negative impact of high public debt on economic growth, starting with the graph below, which compares public debt-to-GDP ratios against real income per capita:
Plenty of evidence exists to showcase the shackles of high public debt on economic growth, starting with the graph below juxtaposing public debt-to-GDP against real income per capita growth rate:
Numerous studies link high U.S. public debt to slower economic growth by crowding out private investment, diminishing marginal returns on debt, mounting interest costs imposing a “deadweight loss” on the economy and limiting fiscal flexibility.
Carmen M. Reinhart, Vincent R. Reinhart and Kenneth Rogoff found in 2012 that when gross government debt exceeds 90% of GDP for over five years, economies lose about one-third of their growth. U.S. debt passed that level in 2013.
Since 1870, real per capita GDP grew at 2.2% annually; over the past 20 years, it dropped to 1.3%, closely matching their prediction.
Similarly, Andreas Bergh and Magnus Henrekson concluded in 2011 that each 1% rise in government size reduces annual per capita GDP growth by 0.05%–0.1%.
Lacy Hunt, former Dallas Fed senior economist, noted that as the government’s size rose from 25.2% of GDP in 1971 to 34.3% in 2023, growth declined from 2.2% to 1.3%, corresponding with previous estimates.
The Great Stagnation or The Great Stagflation
Surging debt and deficits signal a U.S. economy nearing a “Great Stagnation” of slow growth and low inflation, or more likely, a “Great Stagflation” with sluggish growth and moderately high inflation.
These scenarios, covered in the next article, are worse than a crisis, which can prompt vital reforms. Stagnation or stagflation’s slow incemental decline rarely motivates change. As T.S. Eliot wrote, “The world ends not with a bang, but a whimper”.